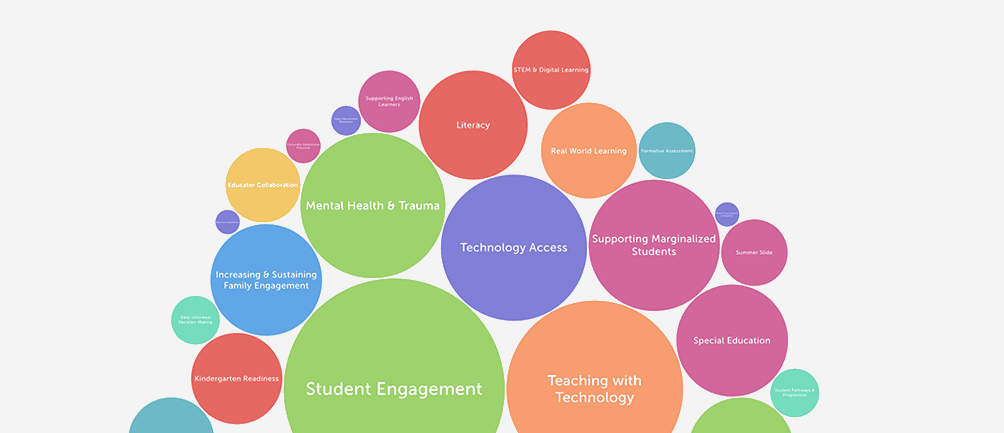
Over 500 public school and district staff members—including teachers, principals, superintendents, and others—from across the U.S. responded to a survey sharing their highest-priority challenges in education. By comparing survey responses collected in Spring 2020 with those from Spring 2019, we’re able to see the impact of the COVID-19 pandemic on priority challenges. Explore the interactive visualization of the results below.
Each circle represents a challenge. The size of the circle is proportional to the number of respondents who reported it as a priority, and the color represents the corresponding theme. Use the dropdown on the right to switch between 2020 and 2019 data, and the filters on the left to view priority challenges based on respondents’ role in education, school level, and district context. Hover over a circle for quick statistics, and click to learn more about the challenge and access additional resources.